Introduction
Trading in financial markets can be a thrilling yet daunting endeavor. The key to success lies in understanding the tools and concepts that can guide your decisions. Among these, support and resistance levels stand out as fundamental principles every trader should grasp. They play a crucial role in predicting market movements and helping traders make informed decisions. So, let’s dive into the world of support and resistance levels and discover why they are indispensable for traders.
What are Support and Resistance Levels?
Definition of Support Levels
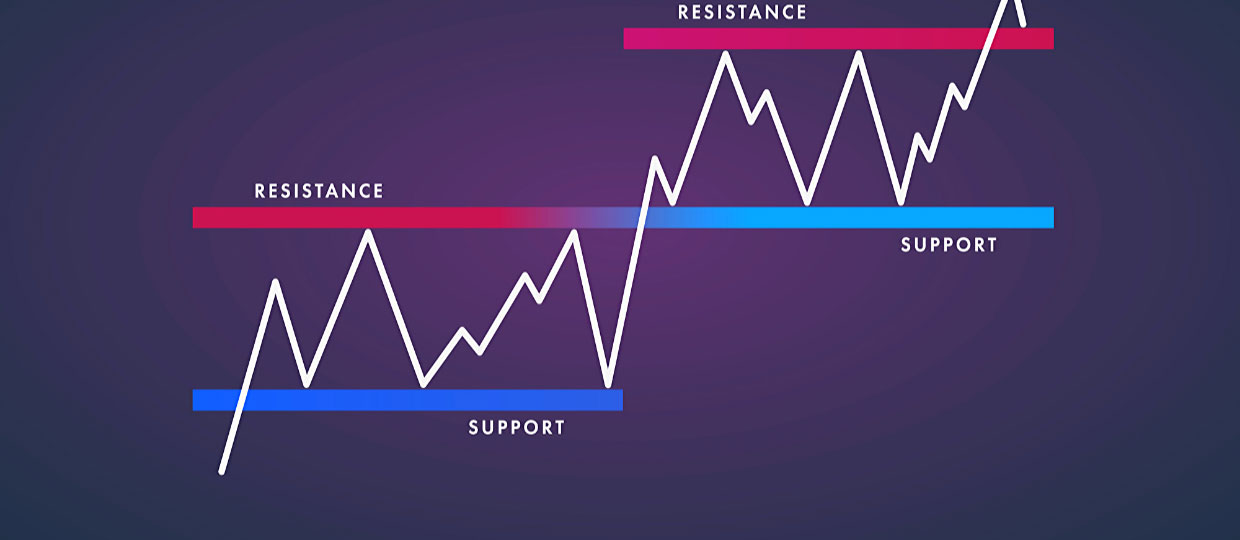
Support levels are specific price points at which a financial asset’s decline typically halts and reverses direction. They function as a floor, preventing further price drops. This occurs because the asset’s price is considered attractive at this level, leading to an influx of buyers.
Definition of Resistance Levels
On the flip side, resistance levels are price points where an asset struggles to rise further. This threshold serves as a cap, stopping the price from rising further. At resistance levels, the quantity of sellers surpasses that of buyers, usually causing the price to reverse.
Why Support and Resistance Levels Matter
Predicting Market Movements
Key price levels, such as support and resistance, play a crucial role in forecasting market trends. They help traders anticipate where the price will halt and reverse, providing opportunities to enter or exit trades effectively.
Aiding in Decision Making
These levels offer a framework for making trading decisions. By identifying where the price is likely to encounter obstacles or support, traders can plan their strategies, set entry and exit points, and manage risk more effectively.
How to Identify Support and Resistance Levels
Historical Data Analysis
A straightforward way to pinpoint levels involves examining past price movements. By looking at past price movements, traders can pinpoint levels where the price has consistently bounced or reversed.
Using Trendlines
Drawing trendlines on a price chart is another effective way to identify support and resistance levels. Linking the peaks and troughs of price shifts can underscore these pivotal thresholds.
Incorporating Moving Averages
Utilizing moving averages aids in the smoothing of price data, facilitating clearer identification of support and resistance levels. They provide a dynamic view of these levels as they change with the price over time.
Tools for Analyzing Support and Resistance
Charting Software
Modern charting software offers a variety of tools to analyze support and resistance levels. Features like drawing tools, indicators, and automated pattern recognition can enhance a trader’s ability to identify these levels.
Technical Indicators
Technical indicators, such as the Relative Strength Index (RSI) and Bollinger Bands, can help traders identify support and resistance levels by highlighting overbought or oversold conditions.
Common Mistakes When Using Support and Resistance
Ignoring Market Context
One common mistake is ignoring the broader market context. To navigate effectively, one must evaluate support and resistance levels in the context of broader market trends to mitigate the risk of misleading indicators.
Over-reliance on Historical Data
While historical data is valuable, relying too heavily on it without considering current market conditions can lead to poor trading decisions. Markets evolve, and past performance isn’t always indicative of future results.
Support and Resistance in Different Market Conditions
Bullish Markets
In bullish markets, support levels are crucial for identifying pullbacks where traders can enter long positions. Resistance levels are crucial in identifying optimal points for potential profit-taking.
Bearish Markets
In bearish markets, resistance levels are vital for identifying rallies where traders can enter short positions. Support levels indicate potential areas for covering shorts.
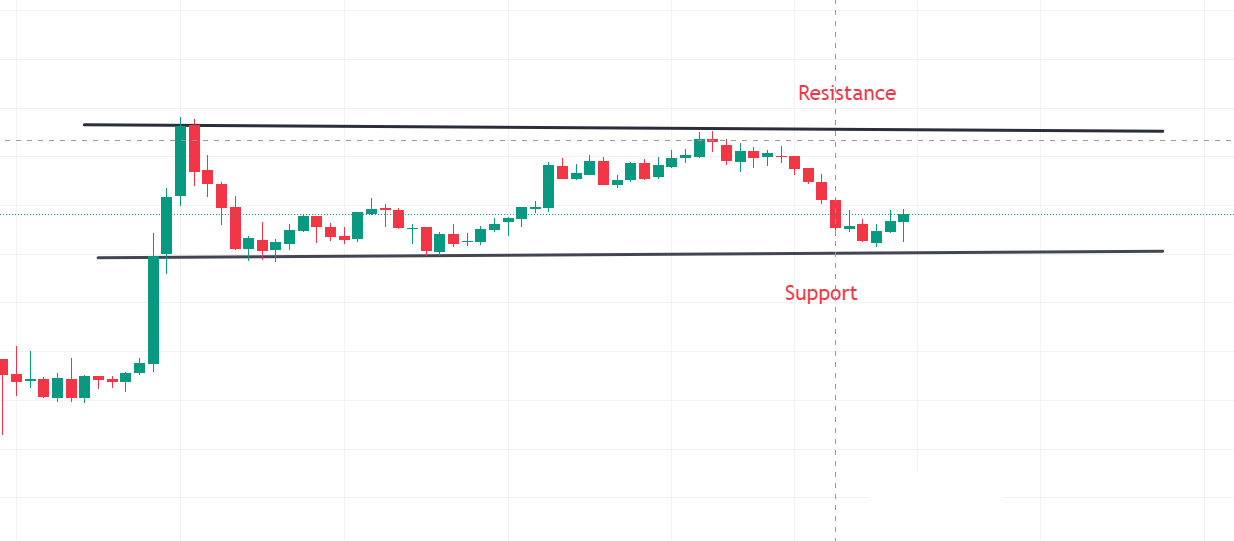
Sideways Markets
In markets that move sideways or within a range, identifying support and resistance levels is crucial for determining the upper and lower limits of the trading range.
Case Studies: Successful Trades Using Support and Resistance
Real-World Examples
Let’s look at a few real-world examples where traders successfully used support and resistance levels to their advantage. These case studies highlight the practical application and benefits of understanding these levels.
Lessons Learned
Each case study provides valuable lessons that can be applied to your trading strategy. By learning from successful trades, you can improve your own approach to using support and resistance levels.
Advanced Techniques for Support and Resistance
Fibonacci Retracements
Fibonacci retracement tools represent sophisticated instruments utilized for pinpointing likely support and resistance thresholds derived from the Fibonacci sequence. These levels are calculated using key percentages and are widely used in technical analysis.
Pivot Points
Pivot points are another advanced technique that traders use to identify support and resistance levels. They are calculated based on the high, low, and closing prices of previous trading sessions and provide potential turning points in the market.
Support and Resistance in Various Trading Strategies
Day Trading
In day trading, support and resistance levels are critical for making quick decisions. They help traders identify short-term opportunities and manage risks effectively.
Swing Trading
Swing traders use support and resistance levels to identify entry and exit points for trades that last several days to weeks. These levels provide a framework for capturing medium-term price movements.
Long-Term Investing
Even long-term investors benefit from understanding support and resistance levels. These levels help identify strategic entry and exit points for holding positions over extended periods.
Psychological Aspects of Support and Resistance
Trader Behavior
Support and resistance levels are often self-fulfilling prophecies due to trader behavior. As traders recognize these levels, their actions reinforce the price movements, creating a psychological barrier.
Market Sentiment
Market sentiment plays a significant role in the effectiveness of support and resistance levels. Positive or negative news can strengthen or weaken these levels, influencing trader behavior.
Integrating Support and Resistance with Other Analysis Methods
Combining with Fundamental Analysis
Combining support and resistance levels with fundamental analysis provides a comprehensive view of the market. Fundamental factors can validate or challenge the technical signals provided by these levels.
Using in Conjunction with News Events
News events can significantly impact support and resistance levels. By staying informed about major news and events, traders can better anticipate market reactions and adjust their strategies accordingly.
The Role of Technology in Identifying Support and Resistance
AI and Machine Learning
Artificial intelligence and machine learning technologies are revolutionizing the way traders identify support and resistance levels. These technologies can analyze vast amounts of data and identify patterns more accurately than traditional methods.
Automated Trading Systems
Automated trading systems use algorithms to execute trades based on predefined support and resistance levels. These systems can operate faster and more efficiently, reducing the emotional bias in trading decisions.
Building a Trading Plan with Support and Resistance Levels
Setting Entry and Exit Points
A well-defined trading plan incorporates support and resistance levels to set clear entry and exit points. Encouraging disciplined decision-making aids traders in steering clear of impulsive actions and adhering steadfastly to their established strategies.
Risk Management
Support and resistance levels are vital for managing risk. By identifying these levels, traders can set stop-loss and take-profit orders to protect their capital and maximize profits.
Conclusion
Mastering the dynamics of support and resistance levels stands as an essential skill for any trader. These pivotal points not only guide market strategies but also empower traders to navigate with precision, enabling informed decisions and adept risk management. By incorporating support and resistance levels into your trading strategy, you can enhance your trading performance and achieve better results. So, take the time to learn and practice using these key indicators to develop a deeper understanding of market dynamics and improve your overall trading prowess.