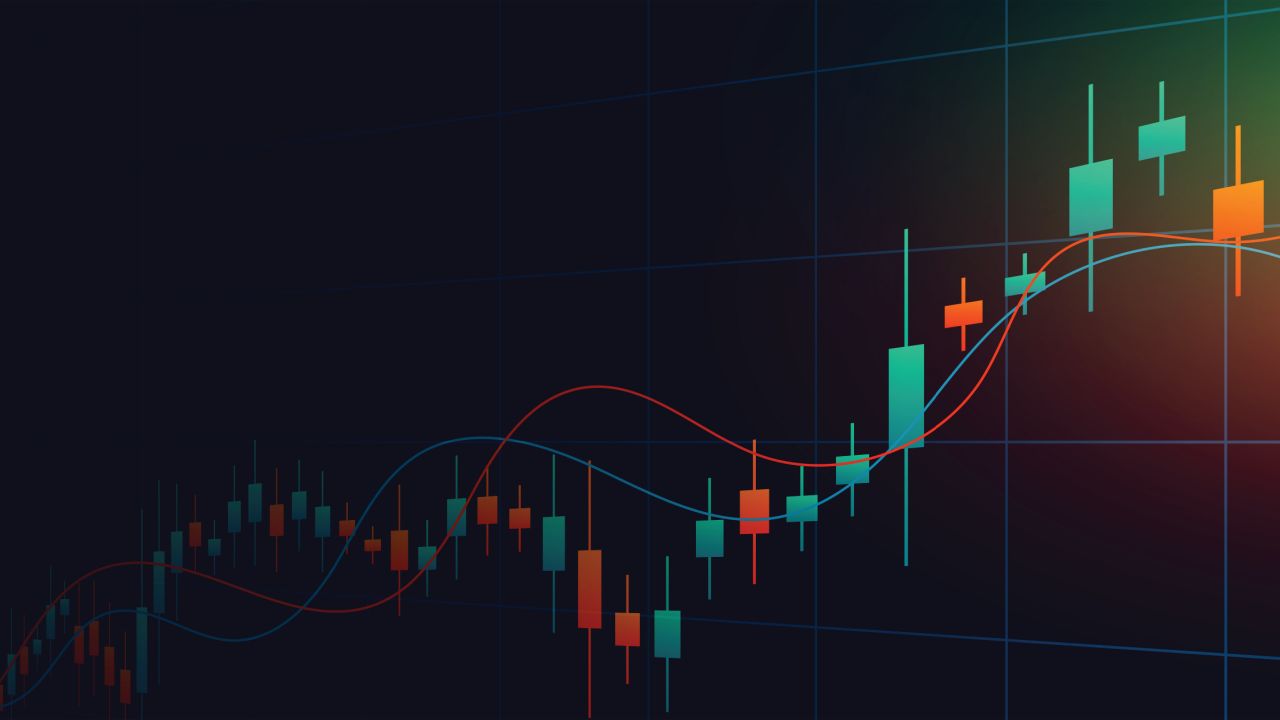
Candlestick patterns are a fundamental tool in technical analysis used by traders to predict future price movements based on historical price data. Originating from Japanese rice merchants in the 18th century, candlestick patterns provide a visual representation of price movements, helping traders to make informed decisions. This article explores the importance of various candlestick patterns in trading, highlighting how they can be utilized to forecast market trends and enhance trading strategies.
Understanding Candlestick Patterns to improve trading
A candlestick chart displays the open, high, low, and close prices of a security for a specific period. Each candlestick consists of a body (the range between the open and close) and wicks (or shadows) representing the high and low prices.
Key Components of a Candlestick
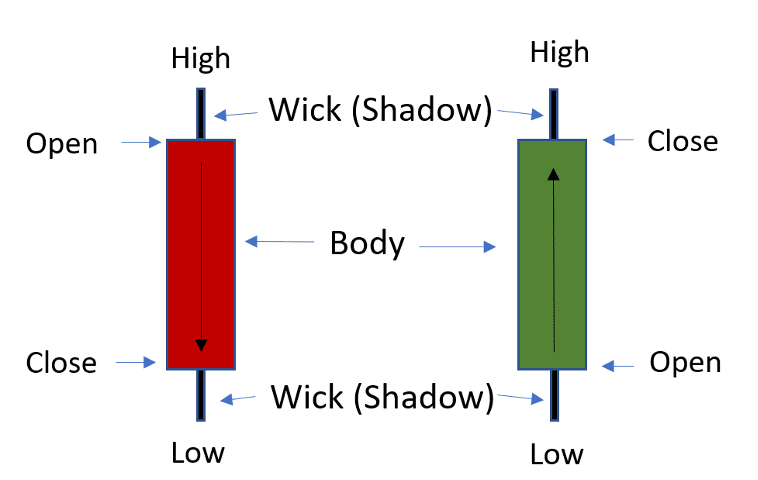
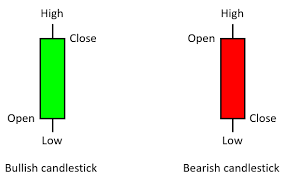
Body: The rectangular area between the open and close prices. If the close is higher than the open, the body is typically green or white, indicating a bullish period. Conversely, if the close is lower than the open, the body is red or black, indicating a bearish period.
Wicks (Shadows): The lines extending from the body, representing the high and low prices within the period.
Important Candlestick Patterns:
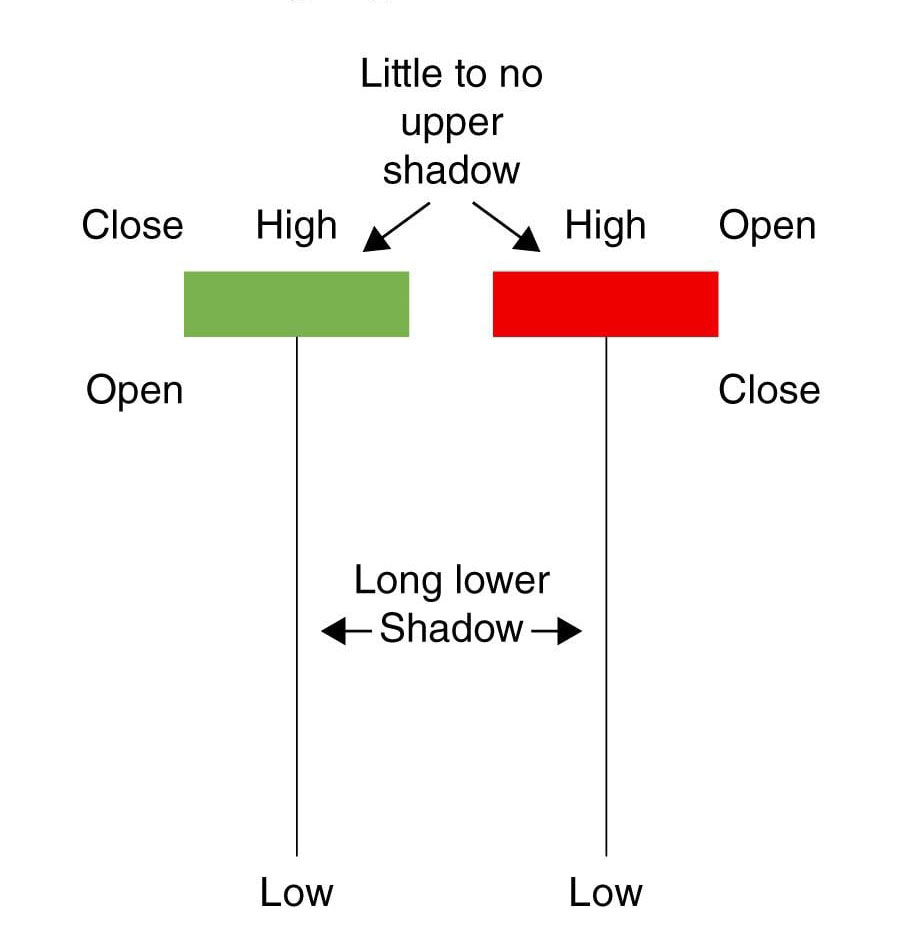
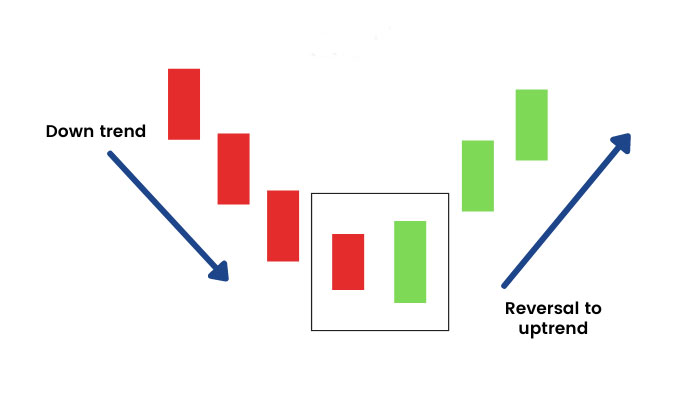
Hammer
The hammer pattern forms at the bottom of a downtrend. It has a small body and a long lower wick, suggesting that sellers pushed prices lower during the session, but buyers managed to drive prices back up near the opening level.
Inverted Hammer
Similar to the hammer, the inverted hammer forms at the bottom of a downtrend but has a small body and a long upper wick. It indicates that buyers attempted to push prices higher but faced resistance, suggesting a potential reversal.
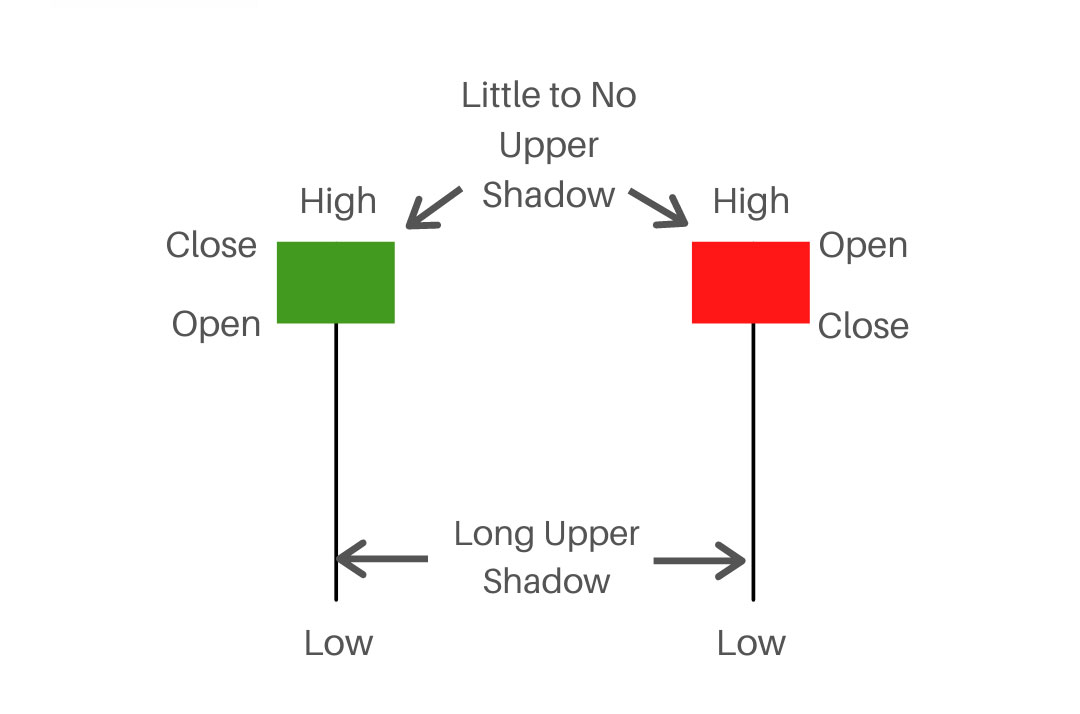
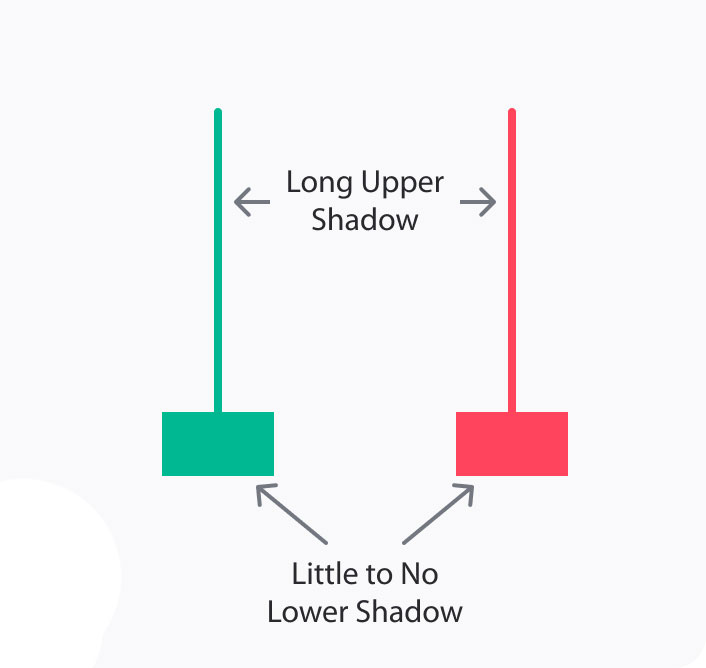
Shooting Star
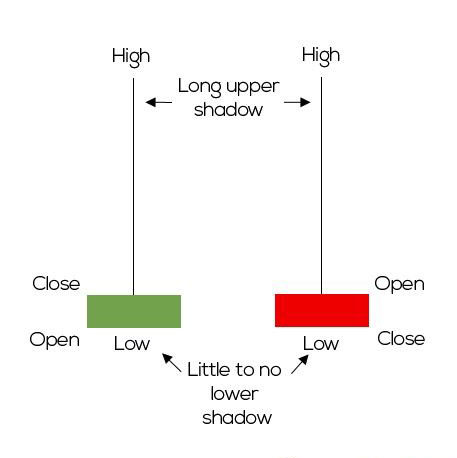
The shooting star forms at the top of an uptrend. It has a small body and a long upper wick, indicating that buyers pushed prices higher during the session, but sellers took control and pushed prices back down near the opening level.
Hanging Man
The hanging man pattern forms at the top of an uptrend and resembles the hammer. It has a small body and a long lower wick, suggesting that sellers pushed prices lower during the session, but buyers managed to drive prices back up near the opening level. However, the selling pressure indicates a potential reversal.
Doji
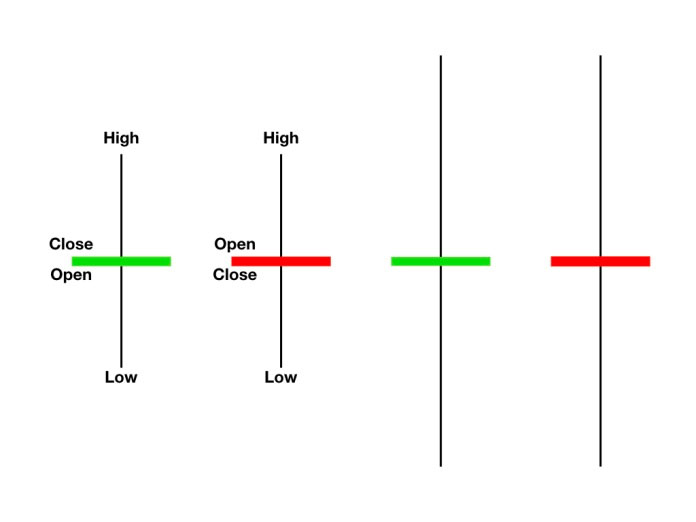
A Doji candlestick pattern is a significant formation in technical analysis and price action trading, indicating indecision in the market. It forms when a security’s opening and closing prices are virtually the same, creating a small or non-existent body, and it often has long upper and lower shadows (wicks). This pattern suggests that neither buyers nor sellers have gained control, leading to a standoff.
Bullish Continuation Patterns
Bullish continuation patterns suggest that the current uptrend will continue, providing traders with confidence to hold or enter new long positions.
Bullish Engulfing
The bullish engulfing pattern consists of a small bearish candle followed by a larger bullish candle that completely engulfs the body of the first candle. This pattern indicates that buyers have taken control, suggesting the continuation of the uptrend.
Rising Three Methods
The rising three methods pattern consists of a large bullish candle, followed by three smaller bearish candles, and another large bullish candle. This pattern indicates that the uptrend is pausing temporarily, but will likely continue.
Bearish Continuation Patterns
Bearish continuation patterns suggest that the current downtrend will persist, helping traders to hold or enter new short positions.
Bearish Engulfing
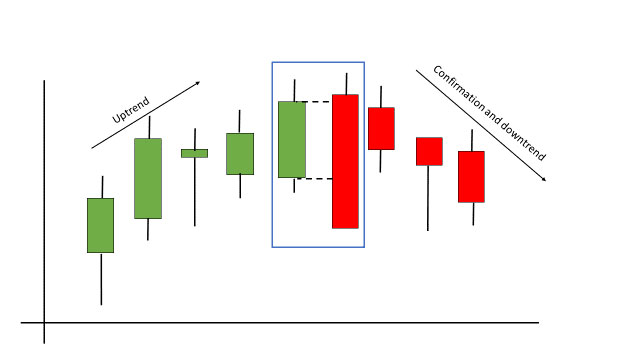
The bearish engulfing pattern consists of a small bullish candle followed by a larger bearish candle that engulfs the body of the first candle. This pattern indicates that sellers have taken control, suggesting the continuation of the downtrend.
Falling Three Methods
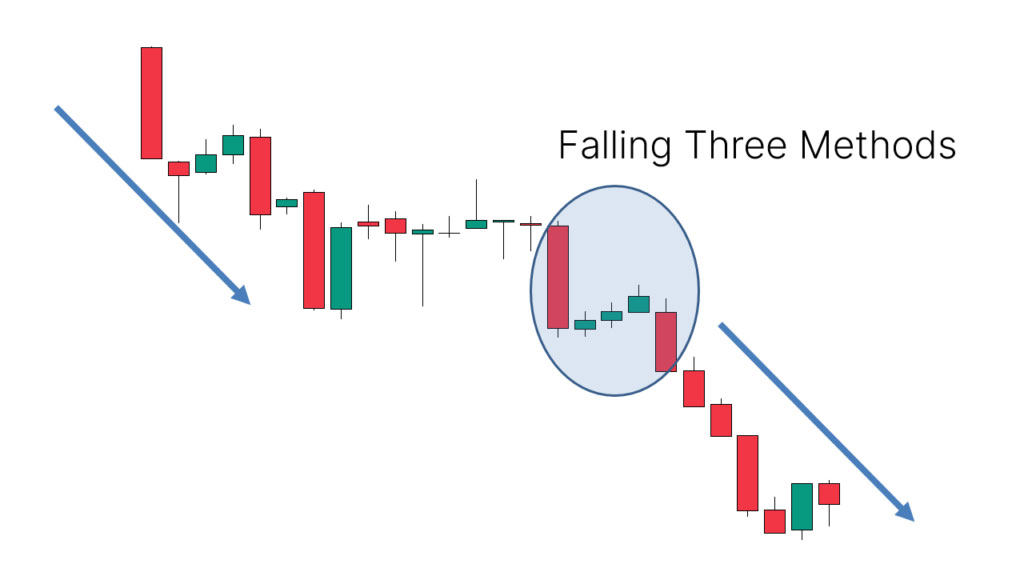
The falling three methods pattern consists of a large bearish candle, followed by three smaller bullish candles, and another large bearish candle. This pattern indicates that the downtrend is pausing temporarily, but will likely continue.
Practical Applications of Candlestick Patterns
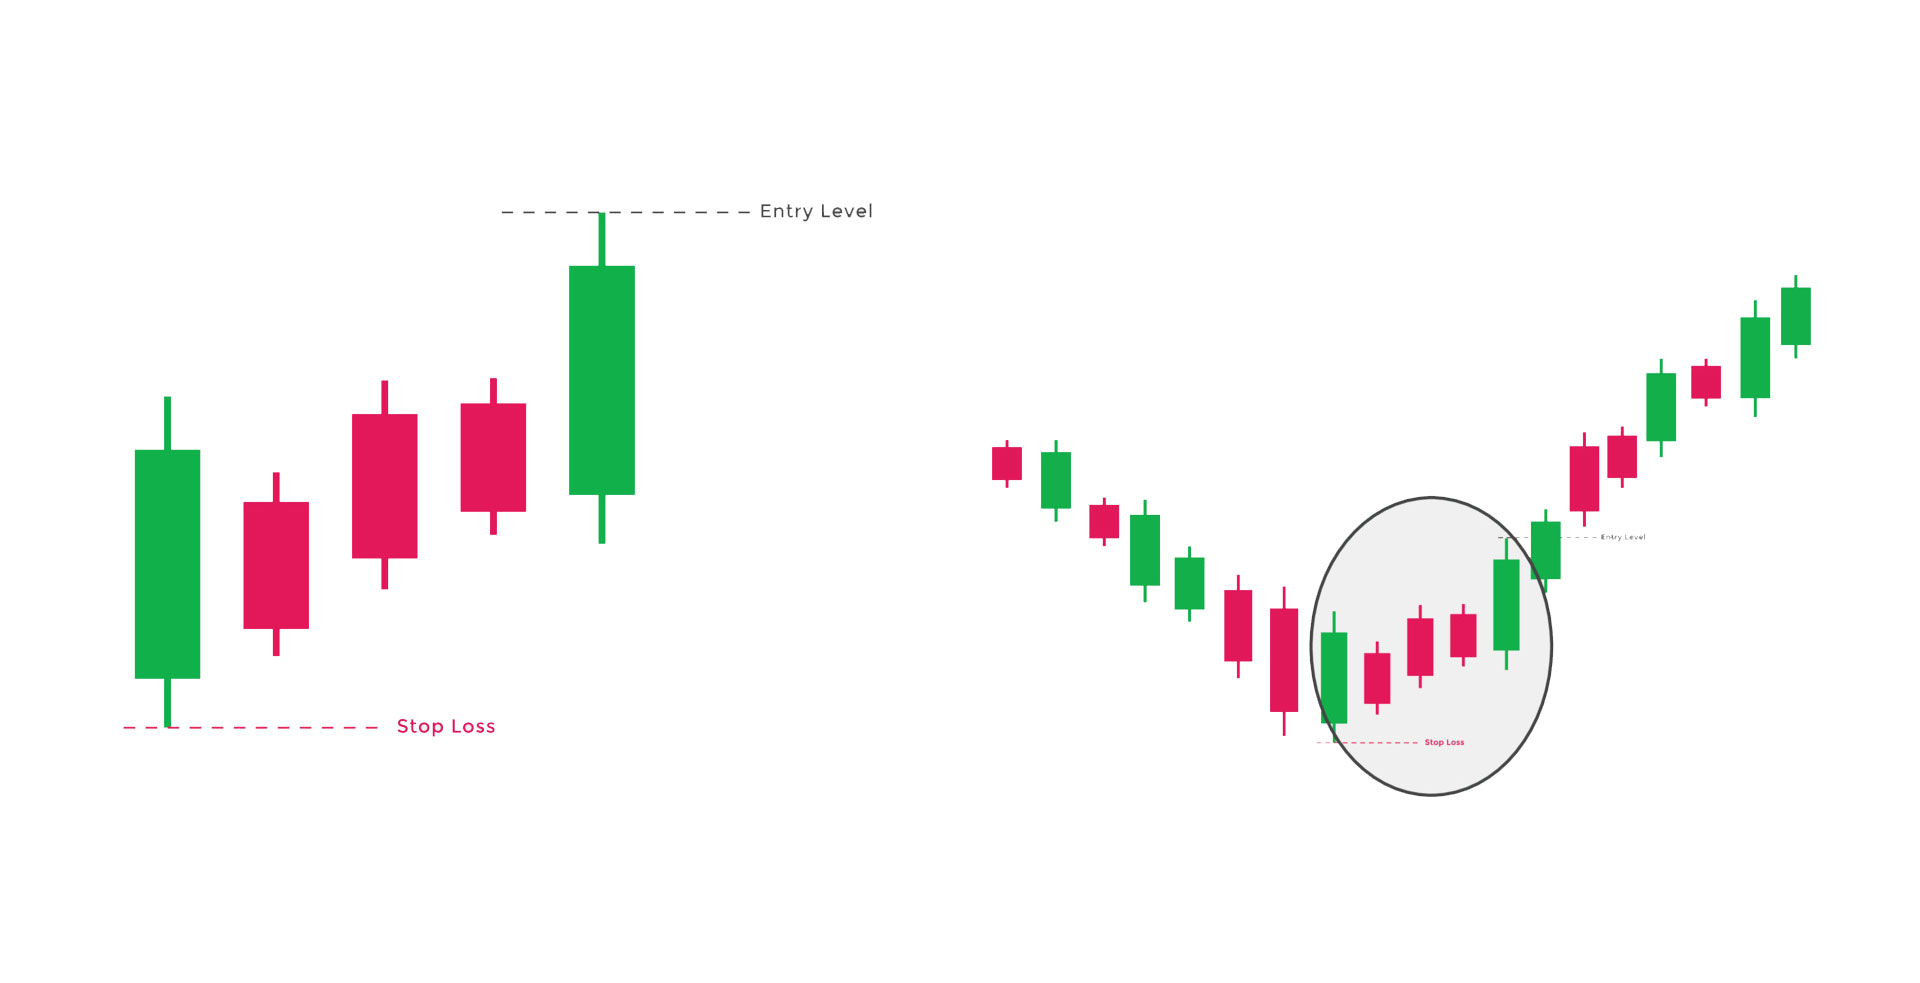
Entry and Exit Points
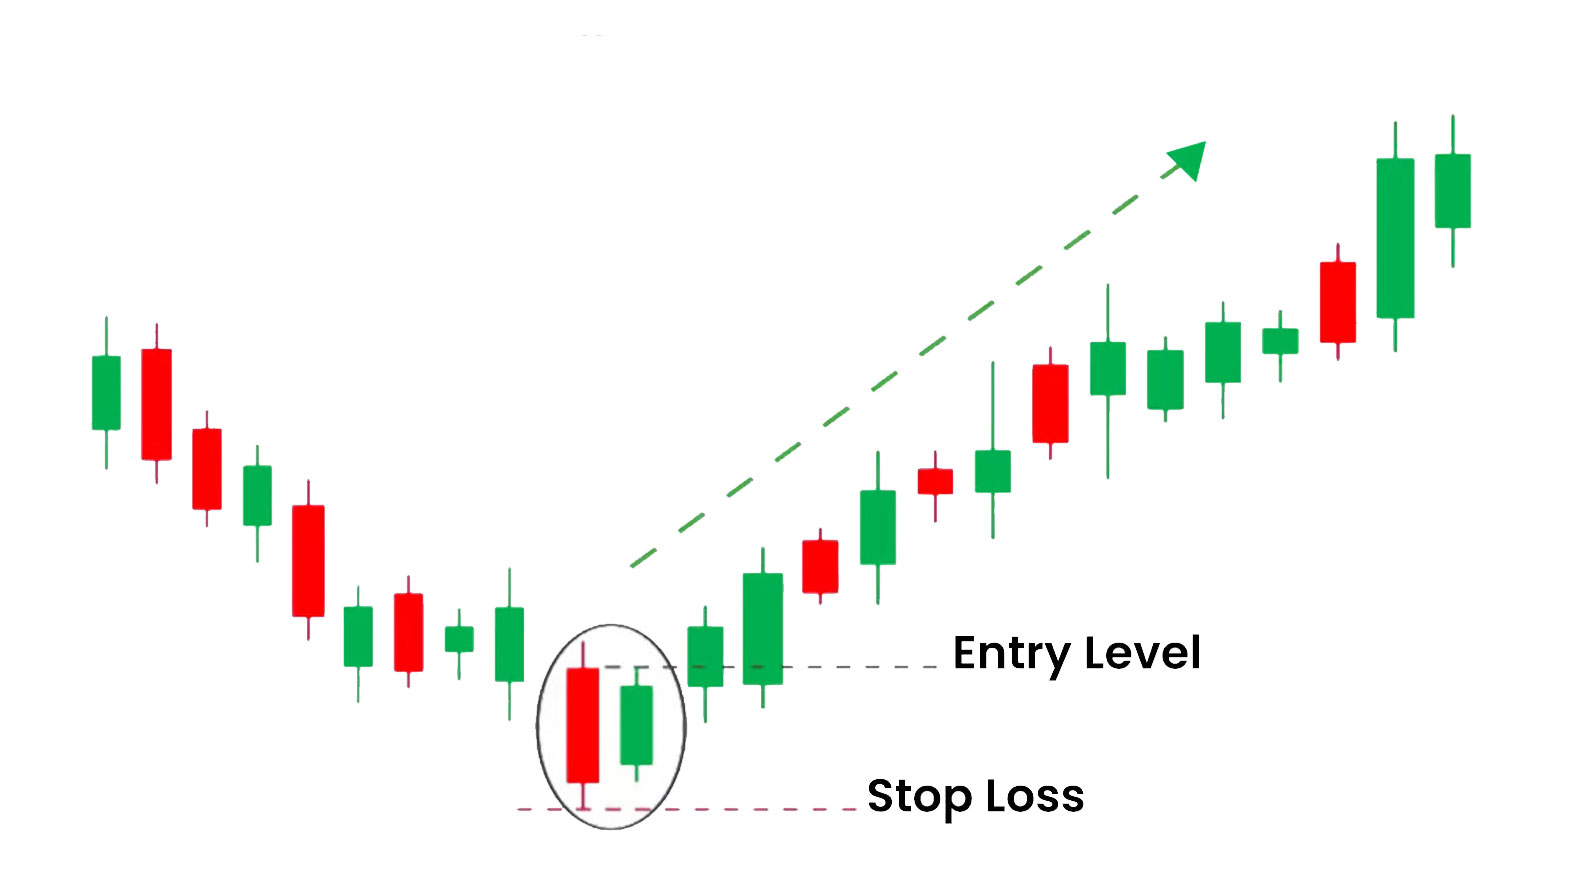
Candlestick patterns are invaluable for identifying entry and exit points in trades. For instance, a bullish reversal pattern like the hammer can signal a good entry point in a downtrend, while a bearish reversal pattern like the shooting star can indicate an exit point in an uptrend.
Confirmation with Other Indicators
While candlestick patterns provide essential insights, they are often used in conjunction with other technical indicators like moving averages, relative strength index (RSI), and volume analysis to confirm signals and improve the accuracy of predictions.
Risk Management
Understanding candlestick patterns helps traders manage risk more effectively. Recognizing potential reversals and continuations allows traders to set appropriate stop-loss and take-profit levels, minimizing losses and maximizing gains.
Conclusion:
Candlestick patterns are a critical tool in a trader’s arsenal. They provide a visual representation of market sentiment and help predict future price movements. By mastering these patterns, traders can make informed decisions, identify profitable trading opportunities, and enhance their overall trading strategy. While candlestick patterns are powerful on their own, their effectiveness increases when used in conjunction with other technical analysis tools, allowing traders to navigate the complexities of the financial markets with greater confidence.
Pingback: Advanced Price Action Techniques You Need to Know in 2024
Pingback: How to read option chains for profitable trading
Pingback: Top 5 Trading Techniques to Boost Your Market Performance
Pingback: 10 Chart Reading Techniques for Maximum Profit in Trading