Reading charts is one of the most important skills for any trader. Whether you’re trading stocks, crypto, or forex, being able to understand and interpret market charts can help you make better decisions and increase your profits. But if you’re new to trading, charts may seem confusing. Don’t worry! In this blog, we’ll break down 10 chart reading techniques that can help you boost your trading skills and maximise your profits.
1. Understand Candlestick Charts
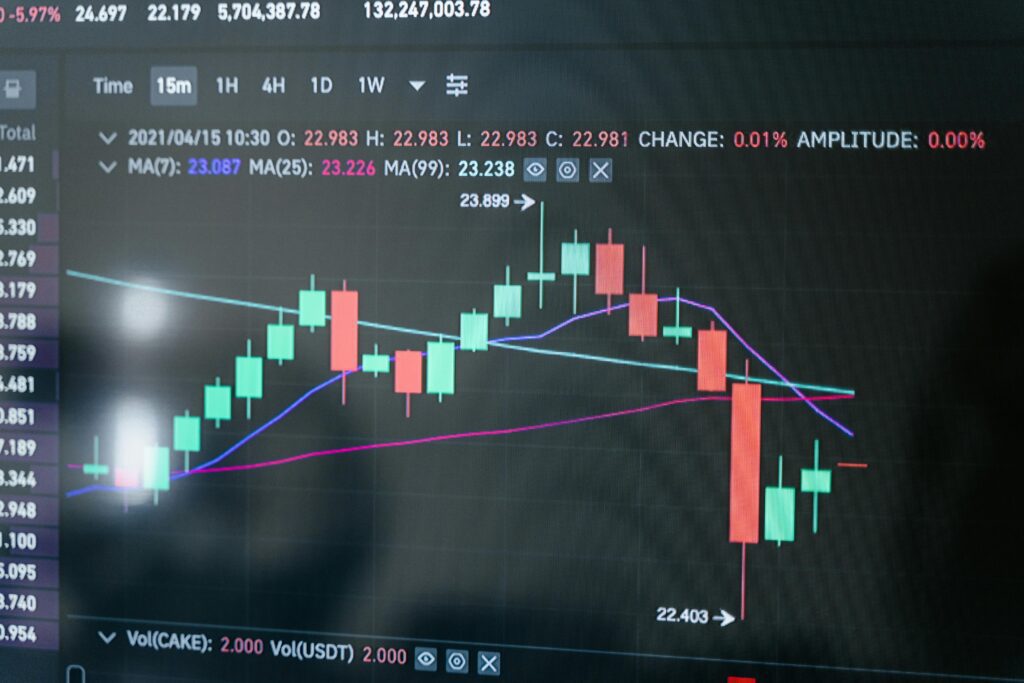
The first step to mastering chart reading is understanding candlestick charts. These charts are widely used because they provide a lot of information in a simple visual form. Each candlestick represents price movement within a specific time frame (like a minute, hour, or day). The body of the candlestick shows the opening and closing prices, while the wicks (or shadows) represent the highest and lowest prices.
- Green/white candles show that the price has gone up.
- Red/black candles show that the price has gone down.
Candlestick patterns can help you spot trends and reversals. For example, a Doji candlestick (where the open and close prices are almost the same) can signal indecision in the market, and may hint at a trend reversal.
2. Recognise Support and Resistance Levels
Support and resistance levels are key areas on a chart where the price tends to stop and change direction. Knowing these levels can help you predict future price movements.
- Support: This is the price level where an asset tends to stop falling and starts to rise again. It’s like a “floor” that prevents the price from dropping further.
- Resistance: This is the price level where an asset tends to stop rising and starts to fall again. It’s like a “ceiling” that the price struggles to break through.
Identifying support and resistance levels can help you decide when to enter or exit trades. For example, you might buy an asset near the support level and sell it near the resistance level.
3. Learn to Identify Trends Using Chart Reading techniques
A big part of trading is identifying trends. A trend is the general direction in which the price of an asset is moving over time. There are three main types of trends:
- Uptrend: When the price is making higher highs and higher lows. This means the market is moving upwards, and you may want to consider buying.
- Downtrend: When the price is making lower highs and lower lows. This suggests the market is moving downwards, and selling might be the best option.
- Sideways trend: When the price moves within a range without any clear upward or downward movement.
Recognising trends early can help you ride them to maximise your profits.
4. Use Moving Averages
Moving averages (MA) are one of the most popular tools in chart reading. A moving average smooths out price data to create a clearer picture of the market’s direction over time.
- Simple Moving Average (SMA): This calculates the average price over a specific number of periods.
- Exponential Moving Average (EMA): This gives more weight to recent prices, making it more responsive to new data.
When the price crosses above a moving average, it could signal a buying opportunity. If the price falls below the moving average, it might be time to sell.
5. Study Volume Indicators
Volume refers to the number of shares or contracts traded in a given period. Volume indicators show how much trading activity is happening in the market. If a price move is supported by high volume, it’s considered strong. On the other hand, price movements with low volume may not last long.
- Volume spikes: A sudden increase in volume can indicate that a major move is coming. It shows heightened interest in that particular asset.
- On-Balance Volume (OBV): This indicator combines price and volume to tell you if more people are buying or selling over time.
By watching volume, you can confirm the strength of a trend and avoid false signals.
6. Understand Chart Patterns Using Chart Reading techniques
Chart patterns are shapes that form on a chart, and they can help you predict future price movements. Some common patterns include:
- Head and Shoulders: This pattern indicates a potential reversal from an uptrend to a downtrend. It consists of three peaks, with the middle one (the “head”) being the highest.
- Double Top and Double Bottom: A double top pattern signals a reversal from an uptrend to a downtrend, while a double bottom suggests a reversal from a downtrend to an uptrend.
- Triangles: There are ascending, descending, and symmetrical triangles. These patterns indicate that the price is likely to break out in one direction after a period of consolidation.
Learning to recognise these patterns can give you a clearer idea of what the market might do next.
7. Use the Relative Strength Index (RSI)
The Relative Strength Index (RSI) is a momentum indicator that helps you identify overbought or oversold conditions in the market. RSI values range from 0 to 100:
- If the RSI is above 70, the asset is considered overbought and could be due for a price drop.
- If the RSI is below 30, the asset is considered oversold and may be ready for a price increase.
Using RSI can help you spot potential reversal points and make better entry and exit decisions.
8. Master the MACD Indicator
The Moving Average Convergence Divergence (MACD) is another powerful tool for traders. It helps you understand the relationship between two moving averages (typically the 12-day and 26-day EMAs).
- MACD Line: The difference between the 12-day EMA and the 26-day EMA.
- Signal Line: A 9-day EMA of the MACD line.
When the MACD crosses above the signal line, it could signal a buy. When the MACD crosses below the signal line, it might be time to sell. The MACD is especially useful for spotting momentum changes in a trend.
9. Use Fibonacci Retracement Levels
Fibonacci retracement levels are based on a mathematical sequence and are used to find potential support and resistance levels. Traders use these levels to predict where the price may reverse during a trend.
Common retracement levels are 23.6%, 38.2%, 50%, 61.8%, and 78.6%. These levels act as potential points where the price might pause or reverse.
For example, if an asset has been rising, you can use Fibonacci retracement levels to find points where it might pull back before continuing its upward trend.
10. Practice Risk Management
One of the most important aspects of trading is risk management. Even if you’re an expert at reading charts, you should always have a strategy to protect your investments.
- Set stop-loss orders: A stop-loss is an automatic order to sell an asset if the price drops to a certain level. This limits your losses if the market moves against you.
- Use position sizing: Only risk a small percentage of your total capital on any single trade. This prevents one bad trade from wiping out your account.
- Diversify your portfolio: Don’t put all your money into one asset. Spread your investments across different assets to reduce risk.
By managing your risk, you can protect your capital and stay in the game long enough to enjoy the rewards of successful trading.
Conclusion
Reading charts may seem challenging at first, but with practice and the right techniques, you can become a confident trader. By mastering these 10 chart reading techniques—understanding candlestick charts, identifying trends, using moving averages, and more—you can increase your chances of making profitable trades. Remember, trading takes time and patience, so keep learning and practicing until you feel comfortable reading the charts and making informed decisions.
Incorporating these techniques into your trading routine can help you maximise your profits while minimising risk. Happy trading!